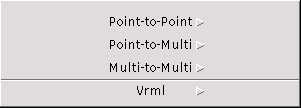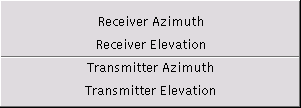
The view menu is used to directly visualize data from simulation runs. A simulation stores its output data in temporary files which are held until the next simulation run or until the program is terminated. If a necessary temporary file is not available (for instance, because the simulation run has not been performed) or if the receiver type does not match, an error message is shown.
The menu groups the entries according to the number of transmitters and receivers that are invoked to produce the output. The output is presented for the currently selected transmitters and receivers.

Point-to-Point means that electromagnetic data between one transmitter and one receiver is visualized. The indices of the transmitter and the receiver to be used must be selected previously through the Select Menu.

The power delay profile plot shows the arrival times in [ns] (nanoseconds) of the different ray-paths versus its received power in [dBm] between the selected transmitter and the selected receiver as being computed by the last Run Field command. The times are given relative to the arrival time of the line-of-sight, i.e., if the line-of-sight path exists, its arrival time is 0.0 (detailed description).
The direction-of-arrival plot shows the arrival angles in [deg] of the different ray-paths between the selected transmitter and the selected receiver as being computed by the last Run Field command. The arrival angles can be inspected both in azimuth and elevation plane. Additionally, its contribution to the received power in [dBm] is indicated. If the line-of-sight path exists, its arrival component is highlighted (detailed description).

Point-to-Multi means that electromagnetic data between one transmitter and a set of receivers, i.e., a trajectory, an area, or a region is visualized. The index of the transmitter to be used must be selected previously through the Select Menu.

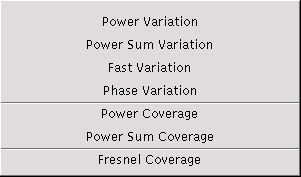
Displays in a new window the power variation plot which shows the received power in [dBm] obtained as the sum of the received powers of the individual ray-paths along the trajectory for the selected transmitter as being computed by the last Run Power command (detailed description). The receiver must be of type trajectory.
Displays in a new window the power sum variation plot which shows the received power in [dBm] obtained as the complex sum of the received powers of the individual ray-paths for each sampling point along the trajectory for the selected transmitter as being computed by the last Run Power command (detailed description). The receiver must be of type trajectory.
Displays in a new window the fast variation plot which shows the difference in [dBm] between the power variation and the power sum variation along the trajectory for the selected transmitter as being computed by the last Run Power command (detailed description). The receiver must be of type trajectory.
Displays in a new window the phase variation plot which shows the phase in [rad] along the trajectory for the selected transmitter as being computed by the last Run Power command (detailed description). The receiver must be of type trajectory.
Displays in a new window the coverage map of the received power (complex sum) in [dBm] for the selected transmitter as being computed by the last Run Power command. If the currently loaded environment coincides with the one used to compute the coverage map, the environment is drawn into the map (detailed description). The receiver must be of type area or region.
Displays in a new window the coverage map of the received power (power sum) in [dBm] for the selected transmitter as being computed by the last Run Power command. If the currently loaded environment coincides with the one used to compute the coverage map, the environment is drawn into the map (detailed description). The receiver must be of type area or region.
Multi-to-Multi means that electromagnetic data between a set of transmitters and a set of receivers, i.e., an area or a region, is visualized.

Displays in a new window the line-of-sight multi-coverage map as being computed by the last execution of the Run LOS M-Coverage command (detailed description).
Displays in a new window the DOP (dilution-of-precision) coverage map as being computed by the last execution of the Run DOP Coverage command (detailed description).
This menu is only available with the VRML-package of RadioTracer.
Starts the VRML-Viewer with the current environment.
Starts the VRML-Viewer with the current environment including the ray-paths as computed by the last Ray Path Computation.