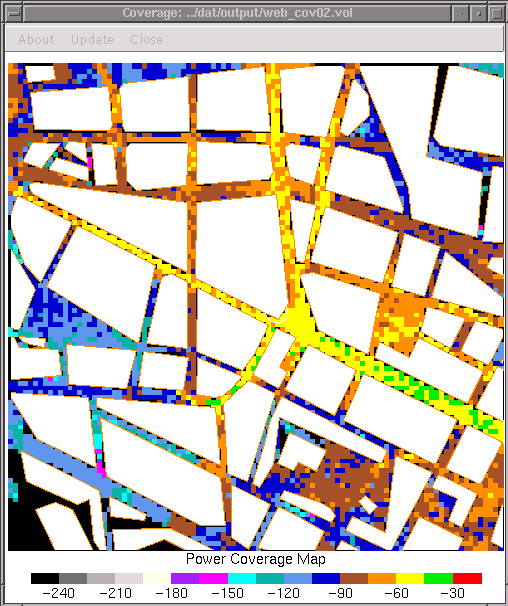
The power coverage map shows the received power in [dBm] as the complex sum, i.e., taking the phase shift into account, of the different ray-paths for all receivers within the area or region and for the selected transmitter. Example of a power coverage map (without thresholds):

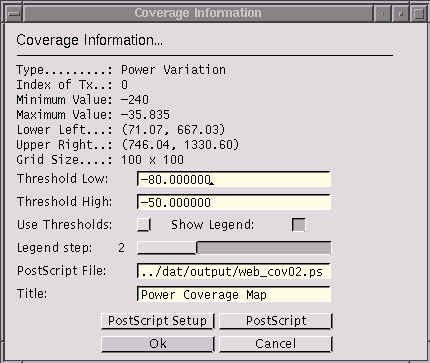
More information and the possibility to update or export the map can be accessed through the [Update] menu entry of the window, which presents, for instance, a dialog like:

The threshold values provide a mean to color the map with only four colors, where the actual color depends whether a certain receiver point reaches at most the threshold as power value.
For a receiver of type trajectory, the power can be visualized as a power variation.