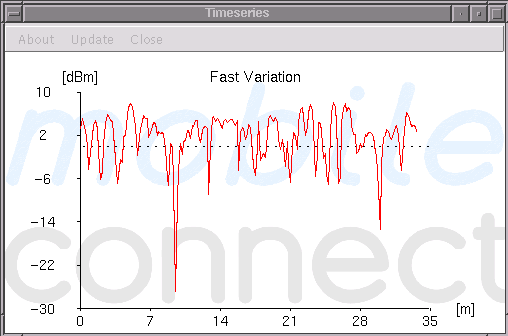
The fast variation plot shows the difference in [dBm] between the power variation and the power sum variation of the different ray-paths along the receiver trajectory for the selected transmitter. Example of a fast variation plot:

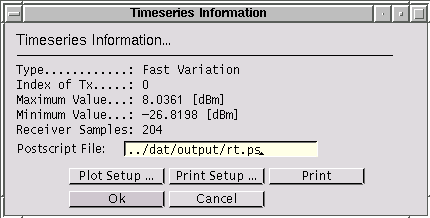
More information and the possibility to update or export the plot can be accessed through the [Update] menu entry of the window, which presents, for instance, a dialog like:
