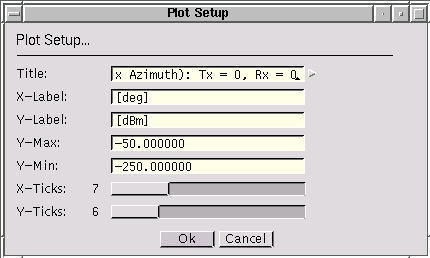
The plot setup dialog is used to configure a specific plot:

An arbitrary title for the specific plot can be entered. The default title names the type of the plot and the indices of the transmitter and the receiver, whenever appropriate.
An arbitrary label for the x- and y-axis for the specific plot can be entered. The default labels indicate the units on the axis for the plot.
The range for the y-values of the specific plot can be entered. The default range is computed automatically such that all data points can be represented. If zero appears within the range, it is marked through a horizontal dashed line in the plot.
The number of ticks to be used on the axis for the specific plot can be entered. The default ticks are set to 6.